Configuring Google Analytics

Learn how to connect and export data from your Google Analytics properties with DataFlowed.

Overview

Google Analytics provides valuable insights into your website's traffic and user behavior. By connecting your Analytics properties, you can export this data to Google Sheets for further analysis, reporting, and visualization.

Prerequisites

Before you can configure Google Analytics exports, make sure you have:

Adding Analytics Properties

To export data from Google Analytics, you first need to select which properties you want to connect:

  1. Access the Google Integration Dashboard

    From your account dashboard, navigate to Connections > Google Integration.

  2. Find the Analytics Section

    In the Google Integration dashboard, locate the Google Analytics section.

    Analytics Section

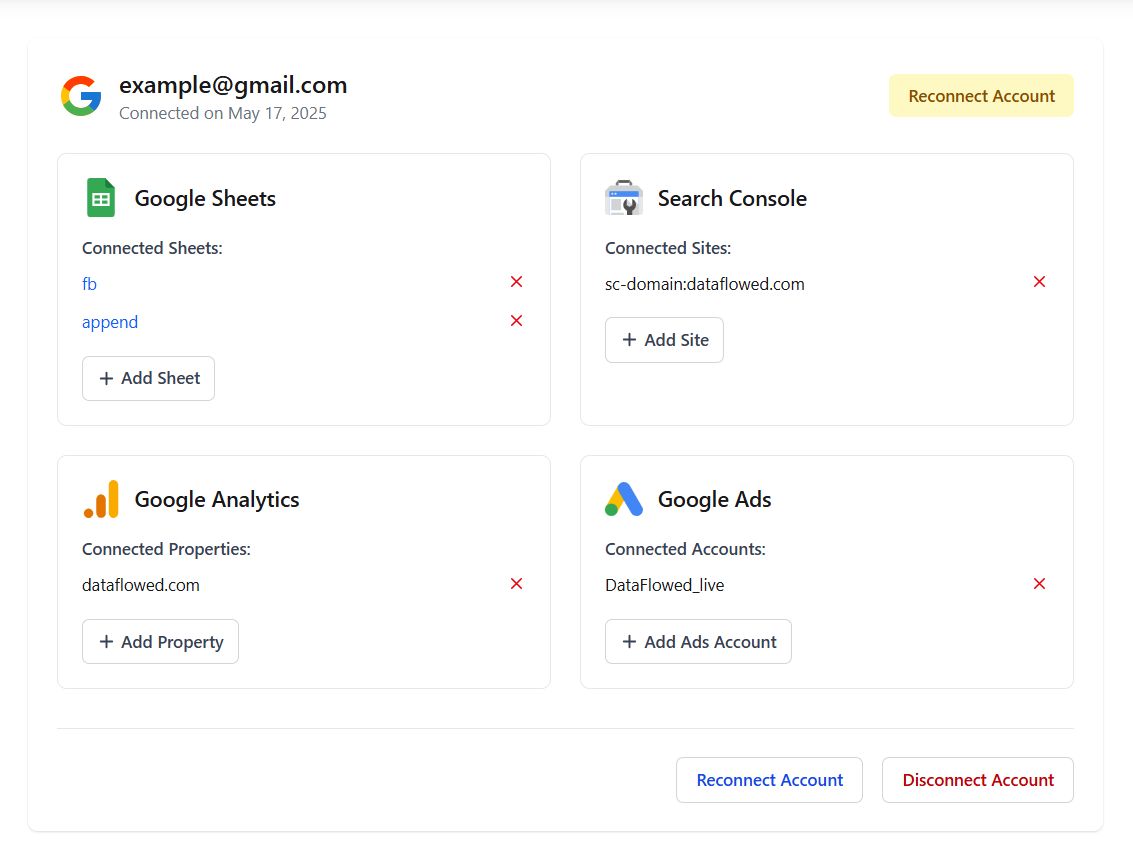
    The Analytics section in the Google Integration dashboard

  3. Add an Analytics Property

    Click the "Add Property" button to open the property selection dialog.

  4. Select a Property

    From the dropdown menu, select the Analytics property you want to connect. The list shows all properties you have access to in Google Analytics.

    Select Analytics Property

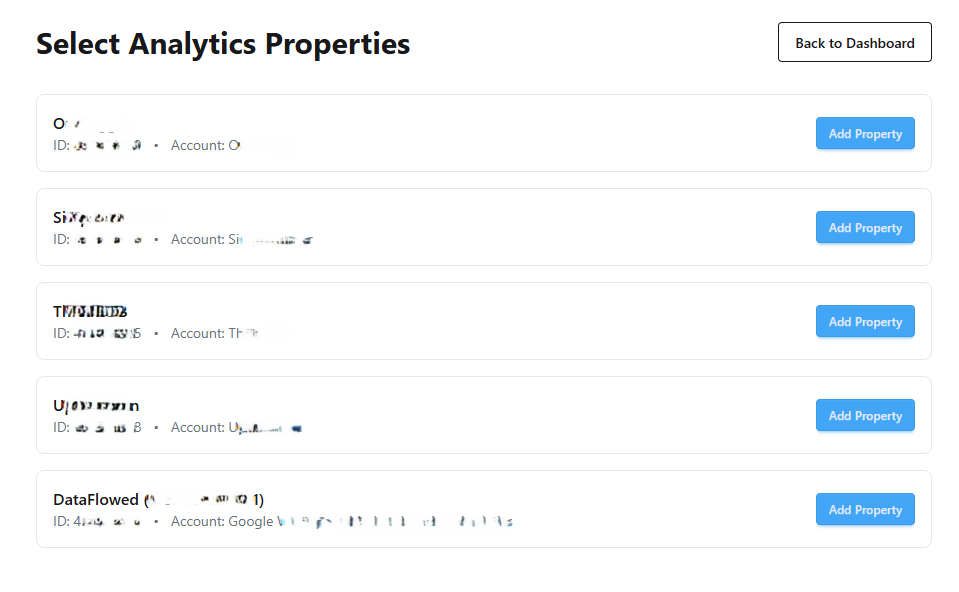
    The property selection dialog showing available Analytics properties

  5. Confirm Your Selection

    Click the "Add Property" button to connect the selected property to your account.

Note

You can only select properties that you have access to in Google Analytics. If you don't see your property, make sure you have the correct permissions and that you're using the same Google account.

Managing Connected Properties

After connecting Analytics properties, you can manage them from the Google Integration dashboard:

Viewing Connected Properties

All your connected Analytics properties are listed in the Analytics section of the Google Integration dashboard. For each property, you can see:

  • The property name
  • The Analytics account it belongs to
  • An option to remove the property from your account

Removing a Property

To remove an Analytics property from your account:

  1. Find the property in the Analytics section of the dashboard
  2. Click the "X" icon next to the property name
  3. Confirm the removal when prompted

Important

Removing a property will not affect your Google Analytics account, but any exporters using this property will stop working. You'll need to update those exporters to use a different property.

Creating Analytics Exports

Once you've connected your Analytics properties, you can create exports to send data to Google Sheets:

  1. Navigate to the Export Builder from your dashboard
  2. Click "Create New Export"
  3. Select "Google Analytics" as the data source
  4. Choose the Analytics property you want to export data from
  5. Select a Google Sheet as the destination
  6. Configure the export settings (see below)
  7. Set up a schedule for the export
  8. Click "Create Export" to save your configuration

For detailed instructions on creating exporters, see our Creating Data Exporters guide.

Analytics Export Settings

When configuring an Analytics export, you'll have several options to customize what data is exported:

Basic Settings

Configure the fundamental settings for your export:

  • Export Name: A descriptive name to identify your export
  • Date Range: Select how much historical data to include:
    • Last day
    • Last 7 days
    • Last 30 days
    • Last 90 days

Dimension Tabs

Analytics exports are organized by dimensions, with each dimension creating a separate tab in your Google Sheet. The interface uses a tab-based layout where you can configure each dimension independently:

Analytics Dimension Tabs

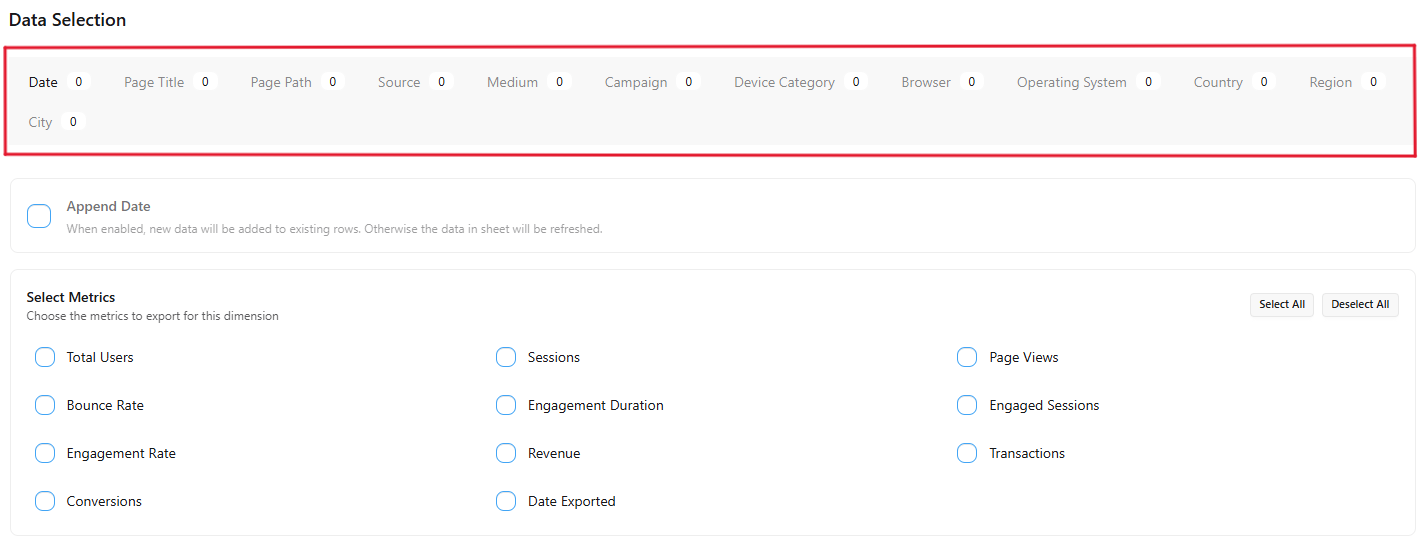
The tab interface for configuring different dimensions

Common dimensions include:

  • Date: Performance data broken down by day
  • Source/Medium: Traffic sources and mediums (e.g., google/organic, facebook/referral)
  • Country: Geographic locations of your users
  • Device Category: Types of devices used (desktop, mobile, tablet)
  • Landing Page: The first pages users visit on your site
  • Campaign: Marketing campaign data

For each dimension tab, you can:

  • Enable/Disable: Choose whether to include this dimension in your export by selecting metrics
  • Set Data Handling: Choose whether to append new data or replace existing data
  • Select Metrics: Choose which performance metrics to include for this dimension

Metrics Selection

For each dimension, you can select which metrics to include in your export:

Analytics Metrics Selection

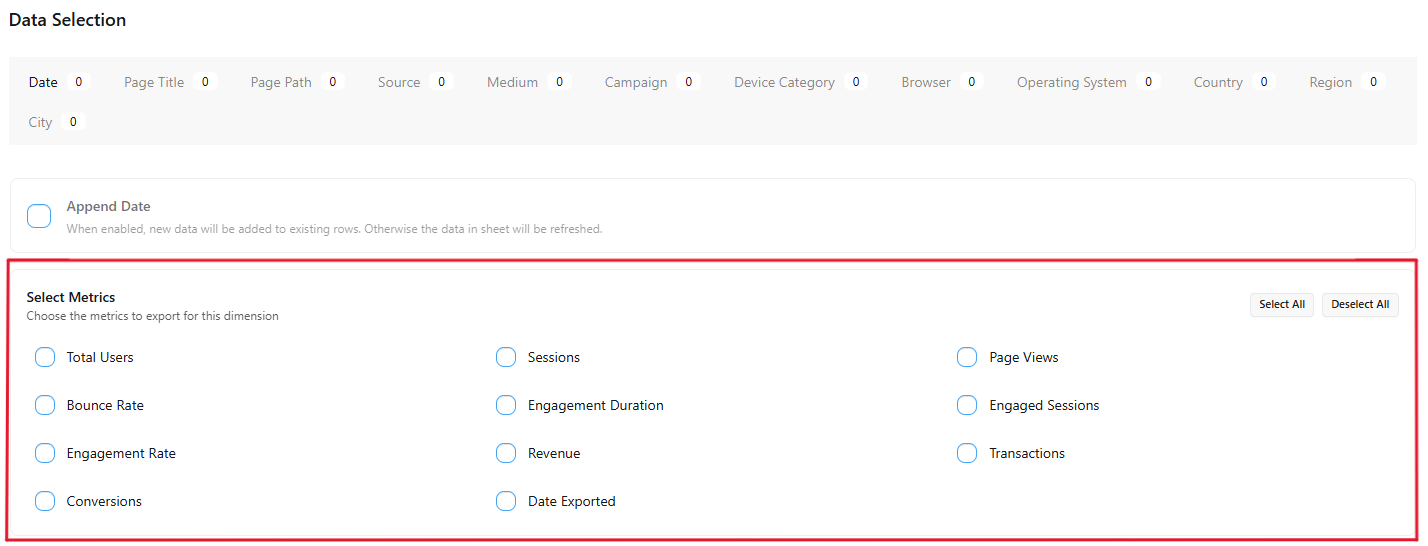
The metrics selection interface for a dimension

Available metrics include:

  • Sessions: Total number of sessions
  • Users: Number of unique users
  • Pageviews: Total number of page views
  • Pages/Session: Average number of pages viewed per session
  • Avg. Session Duration: Average length of a session
  • Bounce Rate: Percentage of single-page sessions
  • Goal Completions: Number of goal completions
  • Conversion Rate: Percentage of sessions that resulted in goal completions

You can use the "Select All" and "Deselect All" buttons to quickly manage your metric selections.

Data Handling

For each dimension tab, you can choose how to handle the exported data:

  • Replace (default): Each export run will clear existing data and replace it with new data
  • Append: Each export run will add new data rows without removing existing data

The append option is particularly useful for building historical datasets. When enabled, new data will be added to existing rows rather than replacing them.

Understanding Tab Badges

Each dimension tab displays a badge showing how many metrics are currently selected. A zero indicates that the dimension will not be included in the export.

Best Practices

  • Focus on Key Metrics: Select only the metrics that are most relevant to your analysis to keep your exports manageable
  • Use Multiple Dimensions: Create exports with different dimensions to analyze your data from various angles
  • Regular Scheduling: Set up daily or weekly exports to build a comprehensive historical dataset
  • Combine with Other Data: Use Google Sheets to combine your Analytics data with data from other sources like Search Console or Ads
  • Create Custom Reports: Use Google Sheets' charting and pivot table features to create custom reports from your exported data

Troubleshooting

Property Not Appearing

If your Analytics property doesn't appear in the selection list:

  • Verify you're using the same Google account that has access to the property in Google Analytics
  • Check that you have at least Read & Analyze permissions for the property
  • Ensure the property is properly set up in Google Analytics

No Data in Exports

If your exports aren't showing any data:

  • Check that your website has traffic during the selected date range
  • Verify that your Analytics tracking code is properly implemented on your website
  • Ensure you've selected at least one metric for each dimension
  • Remember that new websites may have limited data in Analytics

Sampling Issues

If you notice inconsistencies in your exported data:

  • Be aware that Google Analytics may sample data for reports with large amounts of data
  • Try reducing the date range or the number of dimensions/metrics to minimize sampling
  • Consider using shorter, more frequent exports rather than large date ranges

Related Documentation

Stop Juggling Dashboards. Start Growing Get your data flowing today, free plan available.